Forecasting time series with Ngboost regressor (Python version)
This notebook provides some examples of how the functions in the ngboost_models.py module can be used. The functions in this module allow the application of the ngboost regressor model. There are separate methods to train and evaluate (separate the data in train and test datasets), train with all the data available, and make forecasts.
import pandas as pd
from epigraphhub.analysis.forecast_models.plots import *
from epigraphhub.analysis.preprocessing import *
from epigraphhub.analysis.forecast_models.ngboost_models import *
---------------------------------------------------------------------------
ModuleNotFoundError                       Traceback (most recent call last)
/tmp/ipykernel_223/95440347.py in <module>
      1 import pandas as pd
----> 2 from epigraphhub.analysis.forecast_models.plots import *
      3 from epigraphhub.analysis.preprocessing import *
      4 from epigraphhub.analysis.forecast_models.ngboost_models import *

ModuleNotFoundError: No module named 'epigraphhub'
In this tutorial, we will use the data saved in the path: ./data/data_GE.csv. This table represents the number of tests, cases, and hospitalizations (your values by day and differences in first and second order) for some cantons in Switzerland.
df = pd.read_csv('./data/data_GE.csv')
df.set_index('datum', inplace = True)
df.index = pd.to_datetime(df.index)

df
| test_FR | diff_test_FR | diff_2_test_FR | test_NE | diff_test_NE | diff_2_test_NE | test_TI | diff_test_TI | diff_2_test_TI | test_VD | ... | hosp_NE | diff_hosp_NE | diff_2_hosp_NE | hosp_FR | diff_hosp_FR | diff_2_hosp_FR | hosp_GE | diff_hosp_GE | diff_2_hosp_GE | vac_all | |
|---|---|---|---|---|---|---|---|---|---|---|---|---|---|---|---|---|---|---|---|---|---|
| datum | |||||||||||||||||||||
| 2020-03-01 | 0.000000 | 0.000000 | 0.000000 | 0.000000 | 0.000000 | 0.000000 | 0.000000 | 0.000000 | 0.000000 | 0.000000 | ... | 0.142857 | 0.000000 | 0.000000 | 0.428571 | 0.142857 | 0.285714 | 0.428571 | 0.000000 | 0.000000 | 0.0 |
| 2020-03-02 | 0.000000 | 0.000000 | 0.000000 | 0.000000 | 0.000000 | 0.000000 | 0.000000 | 0.000000 | 0.000000 | 0.000000 | ... | 0.285714 | 0.142857 | 0.142857 | 0.857143 | 0.428571 | 0.571429 | 0.428571 | 0.000000 | 0.142857 | 0.0 |
| 2020-03-03 | 0.000000 | 0.000000 | 0.000000 | 0.000000 | 0.000000 | 0.000000 | 0.000000 | 0.000000 | 0.000000 | 0.000000 | ... | 0.428571 | 0.142857 | 0.285714 | 0.857143 | 0.000000 | 0.428571 | 0.428571 | 0.000000 | 0.000000 | 0.0 |
| 2020-03-04 | 0.000000 | 0.000000 | 0.000000 | 0.000000 | 0.000000 | 0.000000 | 0.000000 | 0.000000 | 0.000000 | 0.000000 | ... | 0.285714 | -0.142857 | 0.000000 | 0.714286 | -0.142857 | -0.142857 | 0.571429 | 0.142857 | 0.142857 | 0.0 |
| 2020-03-05 | 0.000000 | 0.000000 | 0.000000 | 0.000000 | 0.000000 | 0.000000 | 0.000000 | 0.000000 | 0.000000 | 0.000000 | ... | 0.428571 | 0.142857 | 0.000000 | 1.000000 | 0.285714 | 0.142857 | 0.857143 | 0.285714 | 0.428571 | 0.0 |
| ... | ... | ... | ... | ... | ... | ... | ... | ... | ... | ... | ... | ... | ... | ... | ... | ... | ... | ... | ... | ... | ... |
| 2022-08-26 | 165.857143 | -0.714286 | -9.000000 | 137.142857 | 1.000000 | 3.857143 | 406.428571 | -7.714286 | -13.714286 | 650.000000 | ... | 0.000000 | 0.000000 | 0.000000 | 0.142857 | -0.428571 | -0.428571 | 2.571429 | -0.142857 | 0.142857 | 182.8 |
| 2022-08-27 | 165.142857 | -0.714286 | -1.428571 | 137.285714 | 0.142857 | 1.142857 | 405.285714 | -1.142857 | -8.857143 | 650.000000 | ... | 0.000000 | 0.000000 | 0.000000 | 0.142857 | 0.000000 | -0.428571 | 2.571429 | 0.000000 | -0.142857 | 182.8 |
| 2022-08-28 | 159.000000 | -6.142857 | -6.857143 | 135.428571 | -1.857143 | -1.714286 | 407.571429 | 2.285714 | 1.142857 | 645.142857 | ... | 0.000000 | 0.000000 | 0.000000 | 0.142857 | 0.000000 | 0.000000 | 2.142857 | -0.428571 | -0.428571 | 182.8 |
| 2022-08-29 | 151.857143 | -7.142857 | -13.285714 | 130.142857 | -5.285714 | -7.142857 | 360.714286 | -46.857143 | -44.571429 | 615.714286 | ... | 0.000000 | 0.000000 | 0.000000 | 0.142857 | 0.000000 | 0.000000 | 1.857143 | -0.285714 | -0.714286 | 182.8 |
| 2022-08-30 | 123.857143 | -6.714286 | -28.142857 | 107.142857 | -6.285714 | -22.857143 | 293.571429 | -41.714286 | -82.285714 | 505.714286 | ... | 0.000000 | 0.000000 | 0.000000 | 0.142857 | 0.000000 | 0.000000 | 1.428571 | -0.428571 | -0.714286 | 182.8 |
913 rows × 64 columns
Class NGBModel()
This class instantiates a ngboost regressor model. This class takes as input the parameters accepted by a Ngboost model (defined in their documentation), a parameter to define the number of last observations that the model will use as input, a parameter to define the number of days that it will be predicted by the model, the percentage of the train data that will be used as validation, and a parameter to define the early stop of the training. The methods in this class allows the user to train and evaluate the model, to train and save the model and make the forecast using saved models.
This class allows the training of multiple ngboost models, each one specialized in the forecast for a single day.
m = NGBModel(look_back = 14,
            predict_n = 14,
            validation_split = 0.15,
            early_stop = 10)
def remove_zeros(tgt):

    tgt[tgt == 0] = 0.01

    return tgt
Method train_eval()
This method takes the class NGBModel() and trains and evaluates this model. This function split the data in train and test dataset and returns the predictions made using the test dataset.
df['hosp_GE'] = remove_zeros(df['hosp_GE'].values)

df_p = m.train_eval(target_name = 'hosp_GE',
                    data = df,
                    ini_date = '2020-05-01',
                    end_date = '2022-04-30',
                    ratio = 0.8, save = False)

df_p
| target | lower | median | upper | train_size | |
|---|---|---|---|---|---|
| date | |||||
| 2020-05-02 | 0.285714 | 0.171583 | 0.300695 | 0.526959 | 584 |
| 2020-05-03 | 0.285714 | 0.188583 | 0.363243 | 0.699668 | 584 |
| 2020-05-04 | 0.142857 | 0.077129 | 0.199622 | 0.516653 | 584 |
| 2020-05-05 | 0.142857 | 0.074032 | 0.222506 | 0.668752 | 584 |
| 2020-05-06 | 0.142857 | 0.083643 | 0.205801 | 0.506366 | 584 |
| ... | ... | ... | ... | ... | ... |
| 2022-04-26 | 7.714286 | 1.810433 | 3.324867 | 6.106128 | 584 |
| 2022-04-27 | 6.857143 | 2.234695 | 3.160372 | 4.469492 | 584 |
| 2022-04-28 | 5.714286 | 2.208807 | 3.287218 | 4.892146 | 584 |
| 2022-04-29 | 5.000000 | 1.947474 | 3.324971 | 5.676806 | 584 |
| 2022-04-30 | 5.714286 | 3.261146 | 5.104967 | 7.991267 | 584 |
729 rows × 5 columns
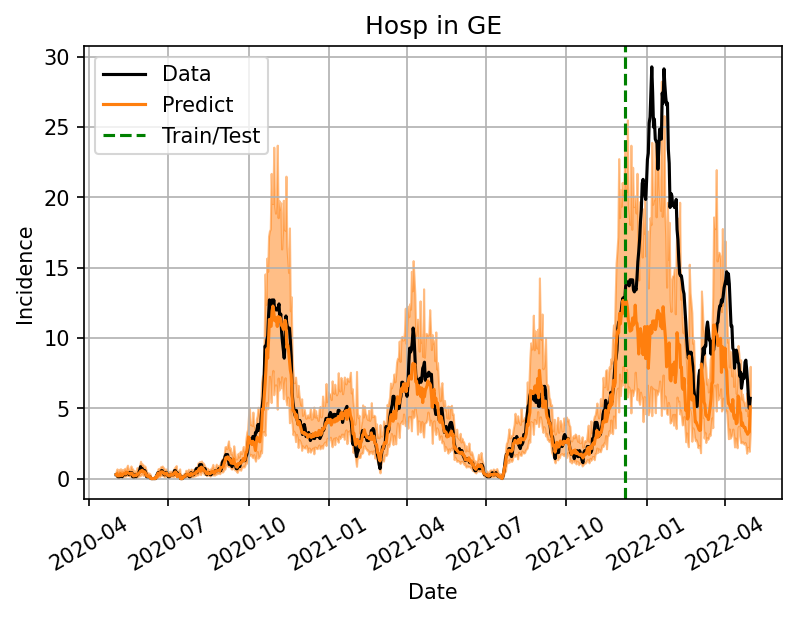
Function plot_val()
This function is saved in the plots.py module and, given the output of the train_eval() method plot the model’s behavior in train and test sample.
plot_val(df_p, title = 'Hosp in GE')
Method train()
This method trains multiple ngboost models with all the data available and will save the model that will be used to make forecasts.
%%time
models = m.train(target_name='hosp_GE',
                 data=df,ini_date = '2020-05-01',
                 end_date = '2022-04-30',
                 save = True,
                 path = './saved_models',
                 name='hosp_GE')
CPU times: user 3min 37s, sys: 653 ms, total: 3min 37s
Wall time: 3min 38s
Method forecast()
This method uses the models trained in the train method and applies them on the last date available (last value in df, or in the data of the date in end_date) and make the forecast making the forecast.
df_f = m.forecast(df, end_date = '2022-04-30',  path = './saved_models', name='hosp_GE')

df_f.head()
| lower | median | upper | |
|---|---|---|---|
| date | |||
| 2022-05-01 | 3.659357 | 4.477327 | 5.478137 |
| 2022-05-02 | 3.678122 | 4.535233 | 5.592075 |
| 2022-05-03 | 3.674208 | 4.571385 | 5.687637 |
| 2022-05-04 | 3.513954 | 4.615518 | 6.062404 |
| 2022-05-05 | 3.800476 | 4.725615 | 5.875958 |
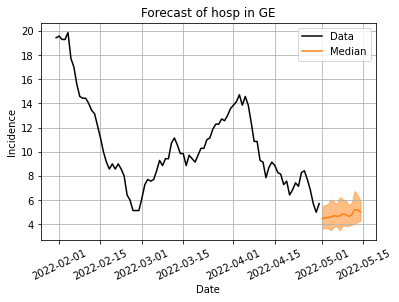
Function plot_forecast()
This function use the data to train the model and the output of the forecast() method to plot the forecast.
plot_forecast(
    df.loc[:'2022-04-30']['hosp_GE'][-90:],
    df_f,
    title = 'Forecast of hosp in GE',
    xlabel="Date",
    ylabel="Incidence",
    save=False
    )